Ad Disclosure
Michigan vs. Iowa is a fascinating clash of styles that will decide the Big Ten championship on Saturday in Indianapolis.
Michigan is arguably the most well-balanced team in the country. The Wolverines boast elite statistical profiles on both sides of the ball. Iowa’s defense is up to par, but its offense is famously among the worst in the country this season.
As a result of that contrast, Michigan is favored by more than 3 touchdowns in this game with a relatively-low over/under total of 35 points.
Let’s examine some betting trends, advanced stats and other useful info about these teams:
Michigan vs. Iowa Betting Lines
Spread: Michigan -22 (DraftKings)
Total: Over/under 35 points (DraftKings)
Check out these great sports betting apps to get in on the action ahead of Saturday’s Big Ten Championship Game.
Betting trends to know for Iowa
- Iowa is 5-5-1 against the spread this season
- The under is 9-2 in Iowa games this season
- Iowa is 2-1 against the spread as an underdog
- The under is 3-0 when Iowa is the underdog
- When the total is 35 points or less in Iowa games this season, the under is 6-0
Iowa’s offense is so bad that the market never really adjusted to it this season — at least from a point total perspective. Betting on the under in an Iowa game was one of the most profitable things a bettor could do in college football this season. And even as the books tried to adjust late in the year, it hasn’t been enough. Iowa has played 5 consecutive games with a total of 33.5 points or less. The under has cashed in every single one of those contests and it has done so by an average of 8.5 points per game.
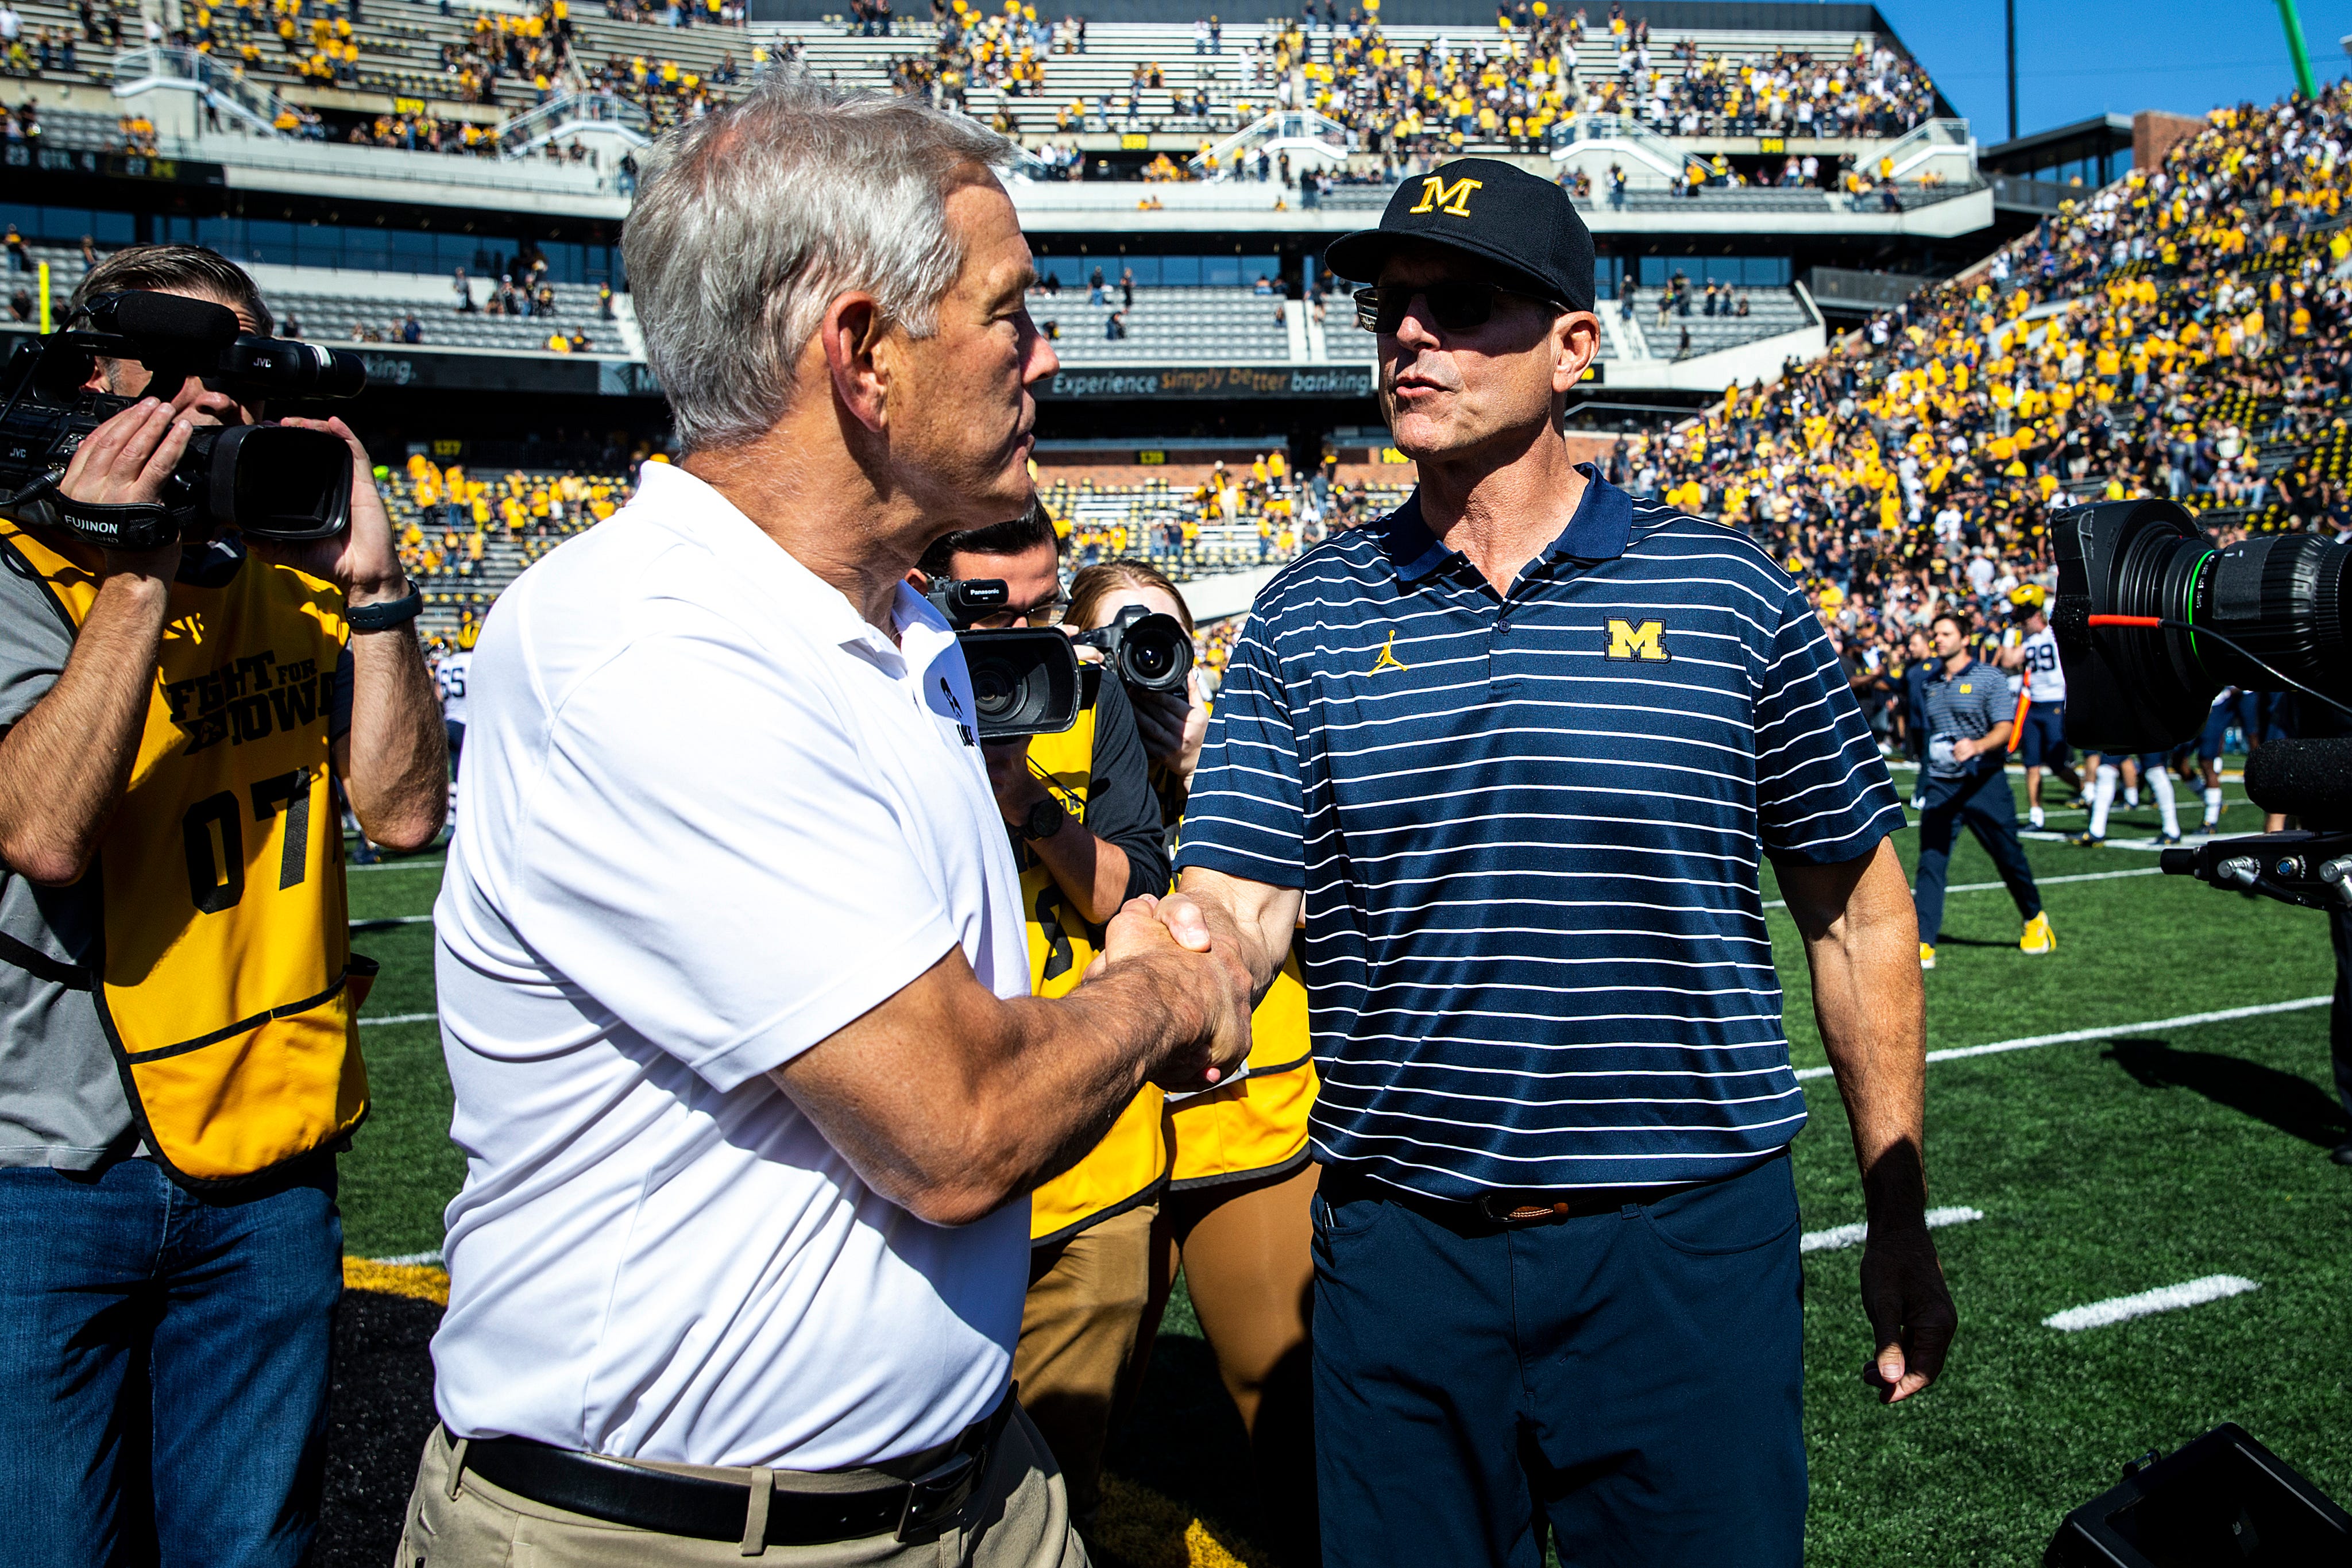
Kirk Ferentz and Jim Harbaugh have faced off 4 times in their respective tenures at Iowa and Michigan. Iowa is 1-3 against the spread in those contests. The one other time they met in the Big Ten Championship Game, Michigan covered with ease in a 42-3 victory.
Betting trends to know for Michigan
- Michigan is 6-5-1 against the spread this season
- The over is 6-5-1 in Michigan games this season
- The over is 6-1-1 in Michigan’s last 8 games
- Michigan is 4-5 against the spread this season when favored by double digits
- Michigan is 4-1-1 against the spread this season with Jim Harbaugh on the sidelines
Michigan didn’t cover a spread until its 5th game of the season against Nebraska on Sept. 30. The Wolverines then went on a mid-season hot streak, covering 4 games in a row during the month of October. They split the difference in November, covering vs. Ohio State and Penn State but failing to beat the number against Maryland and Purdue as much-larger favorites.
It’s rare to see a total as low as 35 in a game where one team is favored by more than a touchdown — let alone 20+ points. I found 3 such instances across all FBS games this season. One involved and Iowa and the other 2 were games played between service academies. All 3 times, the underdog covered:
- Army covered (and won outright) vs. Air Force as an 18.5-point underdog with a total at 33
- Iowa covered (and won outright) vs. Wisconsin as a 9-point underdog with a total of 33.5
- Navy covered vs. Air Force as an 11.5-point underdog with a total of 34
Résumé rankings
Via ESPN’s Football Power Index:
- Iowa strength of schedule: 53rd
- Michigan strength of schedule: 36th
- Iowa strength of record: 16th
- Michigan strength of record: 1st
Advanced Stats preview
Success rate will be the primary tool referenced in this section. Whether or not a play is “successful” depends on the down and distance of a given play. Here’s a breakdown of how much yardage is necessary for a play to be deemed “successful”:
- 1st down: Teams must gain at least 50% of required yardage
- 2nd down: Teams must gain at least 70% of required yardage
- 3rd or 4th down: Teams must gain 100% of required yardage
Defensively, numbers are presented as what the defense allowed the offense to achieve. So on defense, a 35% success rate is better than a 40% success rate.
Let’s dig into what success rate says about this matchup:
Rushing Success Rate
- Iowa rushing offense success rate: 33% (2nd percentile)
- Michigan rushing defense success rate: 33% (96th percentile)
These numbers speak for themselves. It would be stunning to see Iowa run the ball with any sort of effectiveness against Michigan on Saturday in the Big Ten Championship Game. It’s possible this is the single worst rushing offense in the country going up against one of the top rushing defenses in the nation.
- Michigan rushing offense success rate: 47% (77th percentile)
- Iowa rushing defense success rate: 35% (92nd percentile)
As bad as Iowa’s offense is, its defense is quite good. There’s a reason why the Hawkeyes were able to run away with the Big Ten West this season. Iowa has only allowed 2 rushing touchdowns all season and ranks 4th in the Big Ten with a yards-per-carry-allowed mark of 3.09.
Led by Blake Corum, Michigan does have a strong and efficient rushing attack. Michigan acquitted itself well earlier this season when it faced Penn State, which has (statistically) the No. 2 rush defense in the country at 2.16 yards per rush allowed. Michigan went for 227 yards on 46 carries in that game — an average of 4.9 yards per attempt. However, the Wolverines had a success rate of just 33.3% on those 46 carries. If Iowa is going to keep Michigan’s offense in check, it will start with a dominant rushing defense that doesn’t give up big plays.
Passing Success Rate
- Iowa passing offense success rate: 34% (8th percentile)
- Michigan passing defense success rate: 33% (96th percentile)
Iowa’s passing offense is only slightly better than its rushing offense, according to its down-to-down success rate. But this is still a putrid aerial attack. The Hawkeyes have completed under 50% of their passes so far this season. They have 9 passing touchdowns all season and have cleared the 200-yard passing barrier just once. Again, it would be shocking to see Iowa move the ball through the air at all vs. Michigan’s stellar defense.
Michigan just got done facing the 2 most efficient passing offenses in the Big Ten (besides Michigan) in Maryland and Ohio State. The Terps and Buckeyes combined to throw 2 touchdown passes and 4 interceptions in those games. Now comes Iowa, who is dead last amongst Power 5 teams this season in passer efficiency rating. Not only that, Iowa is on pace to have the lowest passer efficiency rating (95.91) by any Power 5 team in a single season since Northwestern in 2019.
- Michigan passing offense success rate: 57% (99th percentile)
- Iowa pass defense success rate: 34% (95th percentile)
This is a matchup between 2 of the best units in the country. It’s worth noting Iowa does appear to be at least somewhat compromised at cornerback, with star Cooper DeJean suffering a season-ending injury in mid-November. But in 2 games without DeJean, Iowa posted a defensive passing success rate of 33.8% — in-line with its season average. Granted, that was against Illinois and Nebraska — passing offenses that rank outside of the top 50 nationally in efficiency — but it’s still good to see the Hawkeyes’ secondary hold up without DeJean.
JJ McCarthy has been the most efficient passer in the Big Ten this season, posting a rating of 176.76. However, the Wolverines have preferred to run the ball in its big games this season. McCarthy attempted a grand total of 28 passes in games against Ohio State and Penn State this season. Contrast that with 85 total rushing attempts for Michigan in those games. I’d expect to see more of the same on Saturday.
Havoc rate
A havoc play is defined as a play where the defense records a tackle for loss, a forced fumble, an interception or a pass breakup.
For defenses, a higher havoc rate is good. Offensively, havoc rates are presented as what the offense allowed the defense to create. On that side of the ball, the lower the havoc rate, the better it is for your offense.
Here’s a breakdown of this matchup:
- Iowa offensive havoc rate: 18% (21st percentile)
- Michigan defensive havoc rate: 21% (95th percentile)
No surprise here given the other numbers we’ve gone over for Iowa’s offense and Michigan’s defense. There’s not likely to be a tremendous amount of offensive plays from Iowa in this game, but when there are, expect Michigan to create more than its fair share of havoc. Another reason to be pessimistic about Iowa’s offense (as if you needed another): the Hawkeyes rank in just the 2nd percentile nationally in passing down success rate. Put another way: when the Hawkeyes get behind the chains, there’s not much they can do to get back on schedule.
- Michigan offensive havoc rate: 11% (97th percentile)
- Iowa defensive havoc rate: 17% (52nd percentile)
Michigan is one of the best teams in the country at limiting havoc, as you’d expect from the 2-time defending Joe Moore Award winners. Michigan leads the Big Ten in tackles for loss allowed. The Wolverines have also only turned the ball over 7 times all season. Defensively, Iowa isn’t special in this area.
Points per opportunity
A scoring “opportunity” is defined as a possession in which the offense has moved the ball beyond the opponents’ 40-yard line. This stat measures how effective a team is at cashing on its scoring chances — or preventing them from their opponents.
- Iowa points scored per opportunity: 2.9 (5th percentile)
- Michigan points allowed per opportunity: 2.43 (99th percentile)
Not only does Iowa create precious few red zone opportunities (less than 3 per game on average), it’s also incredibly wasteful with the opportunities it does get. Iowa has scored a touchdown on just 41% of its red zone chances this season. That’s dead last in the Big Ten and 131st nationally above only Louisiana-Monroe and Kent State.
On the other side, Michigan’s defense has no problems keeping teams out of the end zone. The Wolverines have kept a clean sheet on nearly 30% of its defensive red zone possessions this year. Opposing offenses have found the end zone only 9 times in 21 red zone attempts vs. Michigan in 2023 — a rate of 42.86% that ranks 8th nationally.
- Michigan points scored per opportunity: 4.89 (96th percentile)
- Iowa points allowed per opportunity: 2.49 (99th percentile)
Now, this could be quite interesting. Iowa’s defense is very good at tightening up in the red zone and forcing field goals. On the other side, Michigan’s offense has been very efficient in these opportunities. Against Penn State — the only B1G defense better than Iowa’s on a yards-per-play basis — Michigan averaged 4.8 points per scoring opportunity.
Tracking efficiency
- Iowa offense: 124th
- Iowa defense: 5th
- Iowa special teams: 13th
- Michigan offense: 3rd
- Michigan defense: 2nd
- Michigan special teams: 73rd
- Iowa offense: 124th
- Iowa defense: 1st
- Iowa special teams: 35th
- Michigan offense: 9th
- Michigan defense: 2nd
- Michigan special teams: 5th
Note: All advanced stats mentioned in this story are from CollegeFootballData.com unless otherwise noted. Betting trends are via the Sports Betting Dime database.

Spenser is the news manager at Saturday Road and covers college football across all Saturday Football brands.