Ad Disclosure

What’s the best way to measure a conference’s success? Bowl games.
The method of weighing a league’s strength by postseason performance has been a bit skewed recently, as players have decided to skip bowl games to protect their draft status. Still, it’s the best method we have.
So, that got us thinking, “which B1G teams have been the best in the postseason during the College Football Playoff era?” The answers might surprise you.
You can measure success in a number of different ways, so we settled on three different factors: number of bowl appearances, win percentage and number of bowl victories. Obviously, the win percentage isn’t the best method, as some teams have a better percentage only because they’ve played in fewer bowl games. Still, it’s interesting to factor into the equation.
Here’s a look at some of the postseason numbers for B1G teams from 2014-2018, which includes College Football Playoff games:
By bowl appearances
- Ohio State — 6
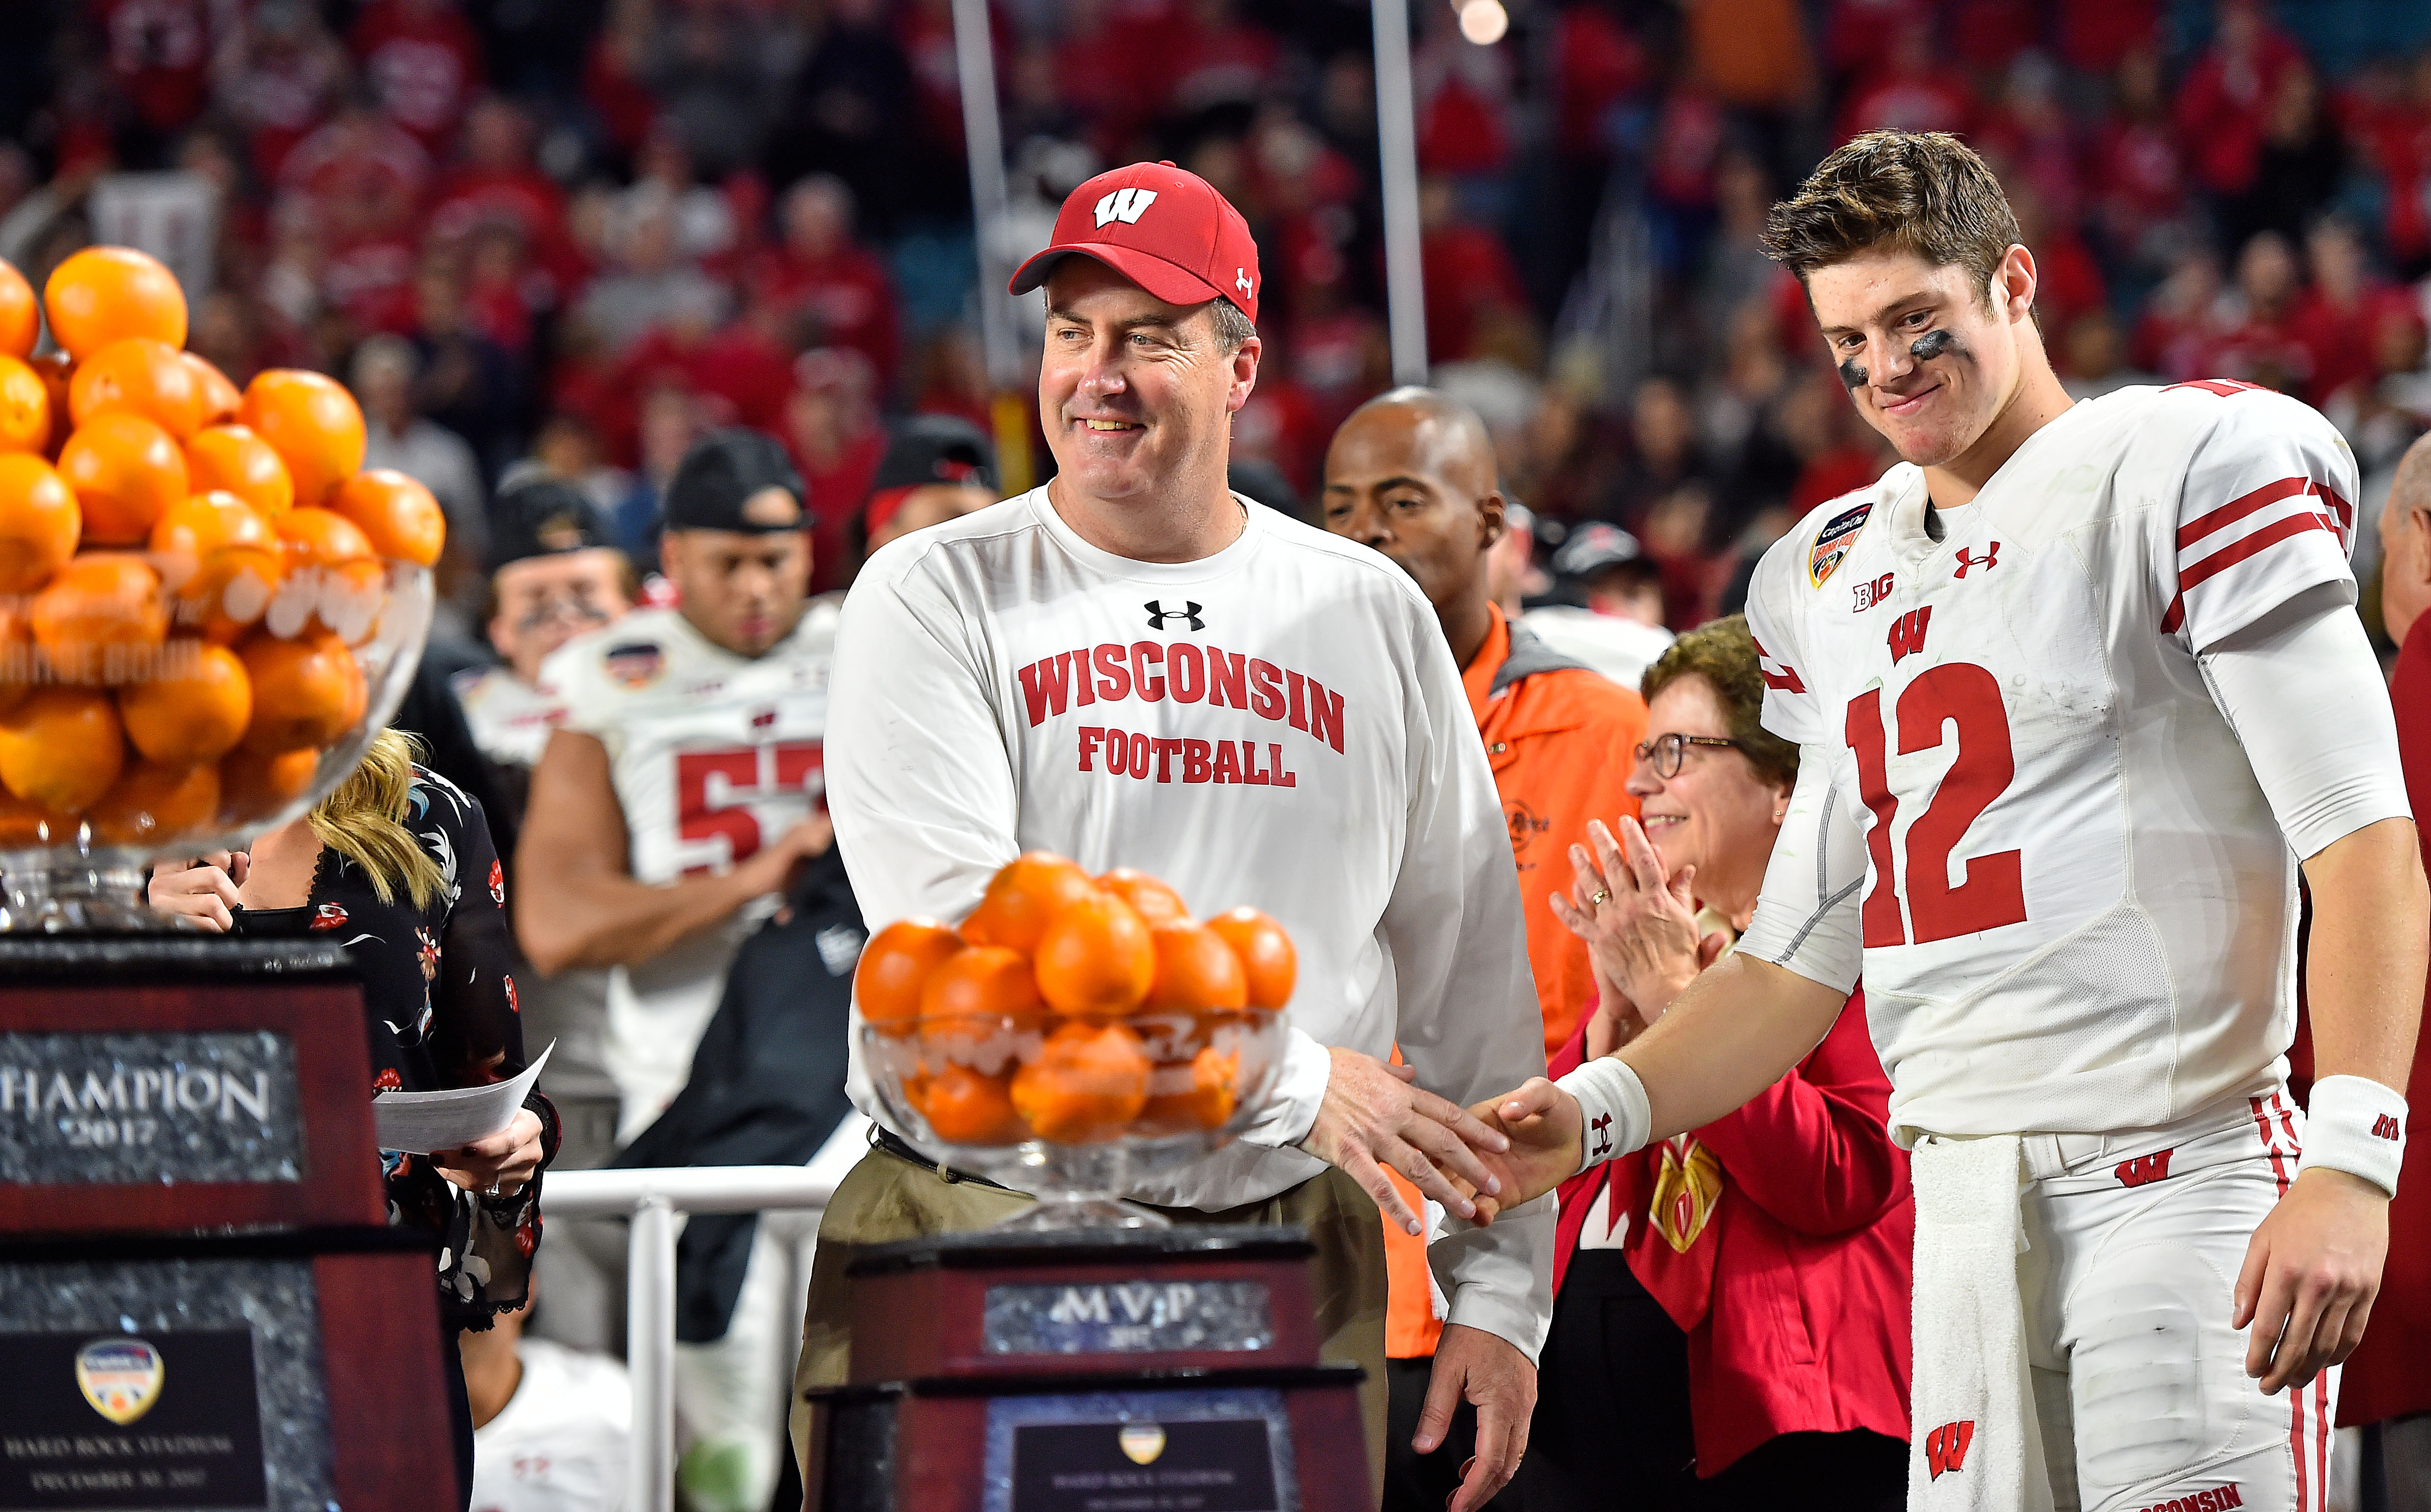
- Wisconsin — 5
- Penn State — 5
- Iowa — 5
- Northwestern — 4
- Michigan — 4
- Minnesota — 4
- Michigan State — 4
- Nebraska — 3
- Purdue — 2
- Indiana — 2
- Maryland — 2
- Illinois — 1
- Rutgers — 1
By win percentage
- Wisconsin — 5-0 (1.000)
- Rutgers — 1-0 (1.000)
- Ohio State — 5-1 (.833)
- Northwestern — 3-1 (.750)
- Minnesota — 3-1 (.750)
- Michigan State — 2-2 (.500)
- Purdue — 1-1 (.500)
- Iowa — 2-3 (.400)
- Penn State — 2-3 (.400)
- Nebraska — 1-2 (.333)
- Michigan — 1-3 (.250)
- Indiana — 0-2 (.000)
- Maryland — 0-2 (.000)
- Illinois — 0-1 (.000)
By total wins
- Wisconsin — 5
- Ohio State — 5
- Minnesota — 3
- Northwestern — 3
- Iowa — 2
- Michigan State — 2
- Penn State — 2
- Rutgers — 1
- Purdue — 1
- Michigan — 1
- Nebraska — 1
Dustin grew up in the heart of Big Ten country and has been in sports media since 2010. He has been covering Big Ten football since 2014. You can follow him on Twitter: @SchutteCFB