Ad Disclosure

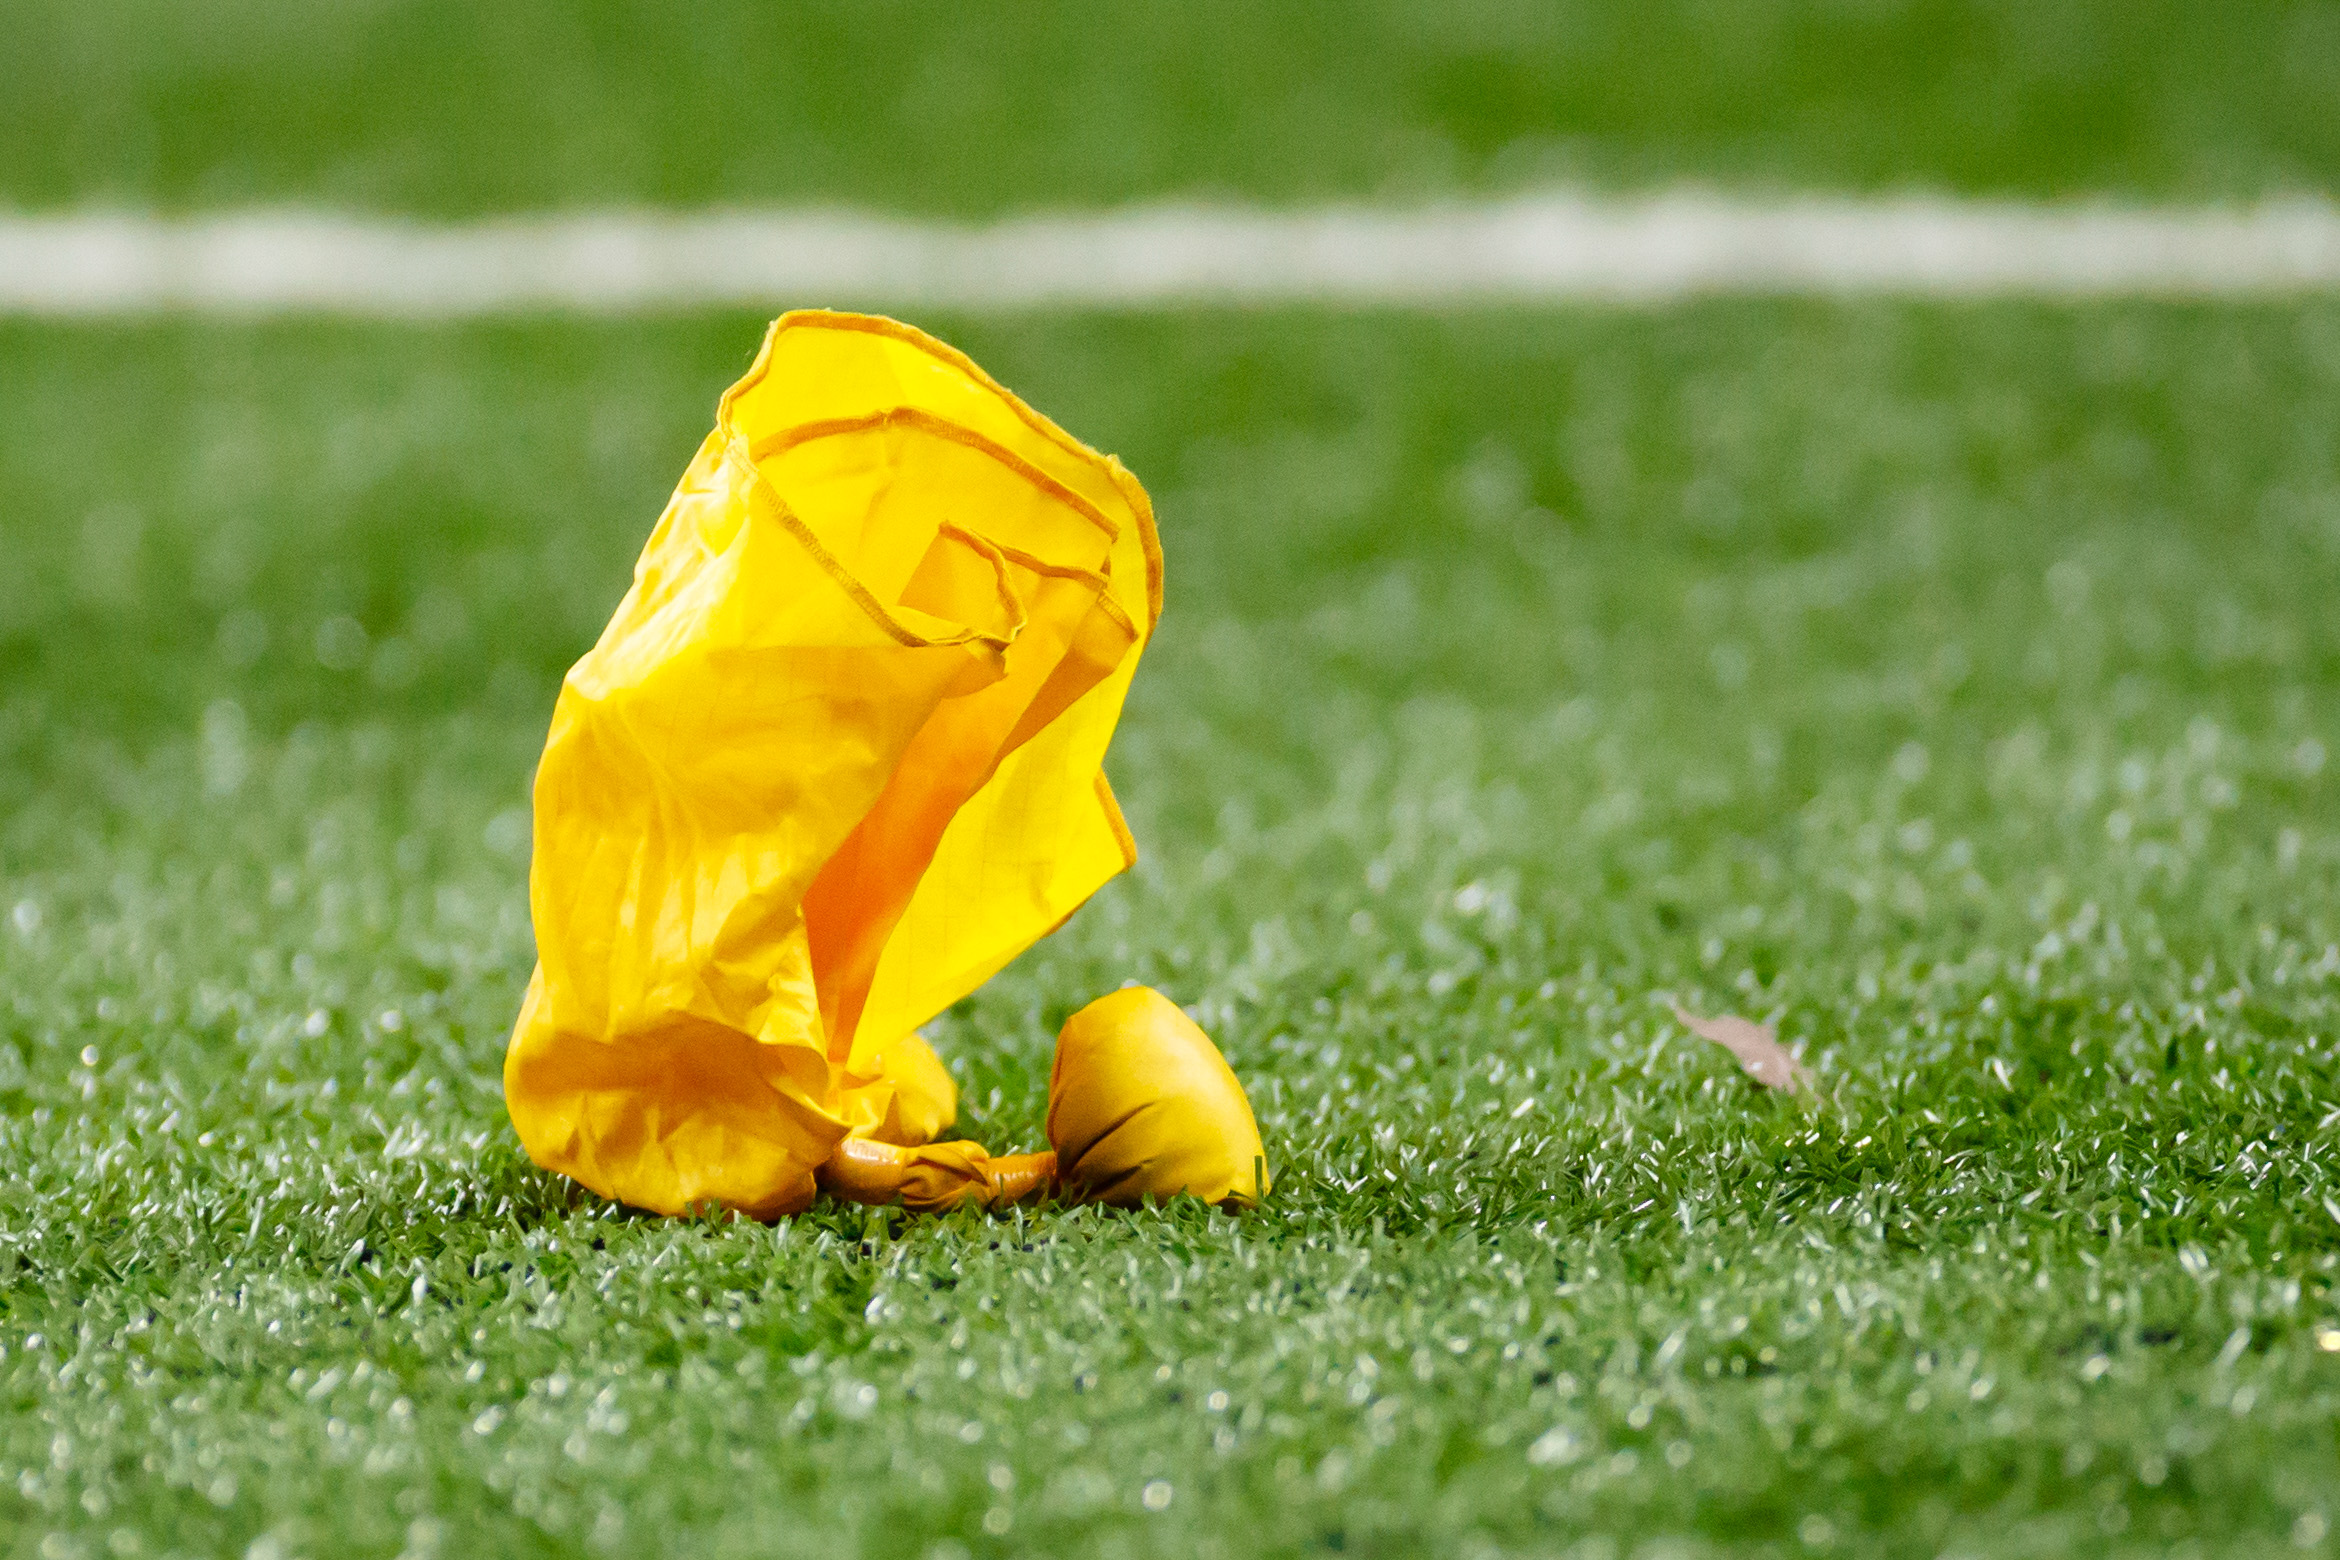
Too much laundry: A look at the B1G’s most penalized teams over the last 5 years
Having discipline is just one of the many features that elite college football teams possess. Understanding how to play the game the right way, without being penalized, is essential for any successful program.
But is there a direct correlation between penalties and winning and losing? While we know the answer differs from game-to-game, we wanted to take a closer look and see if the best teams in the B1G were also the least penalized.
Spoiler alert: that’s not always the case.
Some of the high penalty numbers from Ohio State and Michigan State might be a little surprising. So might the low totals from programs like Iowa and Northwestern.
Look, we all know penalties are going to happen. Even the most elite athletes in the game are bound to make a few mistakes now and then. It’s just the nature of the game. But which teams have been in the habit of committing too many penalties, and which squads are playing really disciplined football?
We’ve dissected the penalty numbers for each team in the B1G over the last five years. Here’s what the results show, measuring from the most penalties and penalty yardage to the fewest:
Total Penalties (2013-2017)
| B1G TEAM | TOTAL PENALTIES | |
|---|---|---|
| Ohio State | 411 | |
| Nebraska | 396 | |
| Michigan State | 392 | |
| Maryland | 391 | |
| Indiana | 381 | |
| Illinois | 375 | |
| Rutgers | 358 | |
| Michigan | 332 | |
| Minnesota | 326 | |
| Penn State | 319 | |
| Wisconsin | 318 | |
| Purdue | 313 | |
| Iowa | 302 | |
| Northwestern | 279 |
Total Penalty Yardage (2013-2017)
| B1G TEAM | TOTAL PENALTY YARDAGE | |
|---|---|---|
| Ohio State | 3,601 | |
| Nebraska | 3,583 | |
| Michigan State | 3,552 | |
| Maryland | 3,474 | |
| Indiana | 3,414 | |
| Illinois | 3,228 | |
| Rutgers | 2,985 | |
| Michigan | 2,943 | |
| Wisconsin | 2,938 | |
| Minnesota | 2,748 | |
| Purdue | 313 | |
| Penn State | 2,644 | |
| Iowa | 2,563 | |
| Northwestern | 2,481 |
Penalties Per Game (2013-2017)
| B1G TEAM | PENALTIES PER GAME | |
|---|---|---|
| Maryland | 6.21 | |
| Nebraska | 6.19 | |
| Illinois | 6.15 | |
| Indiana | 6.15 | |
| Ohio State | 5.96 | |
| Michigan State | 5.94 | |
| Rutgers | 5.77 | |
| Michigan | 5.19 | |
| Purdue | 5.13 | |
| Minnesota | 5.09 | |
| Wisconsin | 318 | |
| Penn State | 4.91 | |
| Wisconsin | 4.68 | |
| Iowa | 4.58 | |
| Northwestern | 4.43 |
Penalty Yards Per Game (2013-2017)
| B1G TEAM | PENALTY YARDS PER GAME | |
|---|---|---|
| Nebraska | 55.98 | |
| Maryland | 55.14 | |
| Indiana | 55.06 | |
| Michigan State | 53.82 | |
| Illinois | 52.92 | |
| Ohio State | 52.19 | |
| Rutgers | 48.15 | |
| Michigan | 45.98 | |
| Purdue | 45.66 | |
| Wisconsin | 43.21 | |
| Minnesota | 42.94 | |
| Penn State | 40.68 | |
| Northwestern | 39.38 | |
| Iowa | 38.83 |
Dustin grew up in the heart of Big Ten country and has been in sports media since 2010. He has been covering Big Ten football since 2014. You can follow him on Twitter: @SchutteCFB